Icelight: First-Party Product Analytics on Cloudflare
I’ve spent quite a bit of time recently exploring different ways to work with data in and out of Apache Iceberg, and evaluating various analytics and visualisation tools. I use Cloudflare a lot for my side projects, and when I saw they were building out their data platform capabilities - including the R2 Data Catalog - I got curious.
Could I actually build a complete, end-to-end product analytics platform entirely on Cloudflare’s infrastructure? One that I fully own, with no third-party analytics vendors, and that could potentially run on the free tier?
I gave it a go, and it turns out that you can. So here is Icelight.
PS: Naming things is hard. Ice is a reference to Iceberg, and Light is a play on the idea that this will generate insights on your behavioural data - but also light in the sense that it runs fully on the edge.
Why First-Party Analytics?
The options for product analytics aren’t great. SaaS tools like Mixpanel and Amplitude get expensive at scale. Self-hosted alternatives like Plausible or PostHog mean managing Kafka, ClickHouse, or Postgres clusters yourself.
Then there’s privacy. GDPR and CCPA/CPRA mean data processing agreements, international transfer safeguards, and access requests across multiple systems when you use third-party processors. Browser changes (Safari ITP, Firefox ETP, third-party cookie deprecation) increasingly block or degrade third-party analytics anyway.
First-party collection from your own domain sidesteps most of this. You control where the data lives, you handle deletion requests directly, and you’re not fighting browser privacy features.
How It Works
The architecture is straightforward:

Events come in through an ingest worker (compatible with RudderStack/Segment SDKs), flow through Cloudflare Pipelines, and land as Apache Iceberg tables in R2. A query API worker then lets you analyse the data using R2 SQL, DuckDB, or a semantic query layer.
You can deploy the whole thing with a few commands once you’ve installed Wrangler and logged in:
git clone https://github.com/cliftonc/icelight.gitcd icelightpnpm installpnpm launchThat’s it. The launch script creates everything - R2 bucket, Data Catalog, Pipeline, and deploys both workers.
If you don’t have a Cloudflare account I would really recommend you create a free one and explore. I have no affiliation to Cloudflare but their current offering is really powerful - I now use it for all of my projects.
What You Get
A Full Semantic Layer
The query API includes a complete semantic layer powered by Drizzle Cube, my other open source project. This means you get the same Cube.js-compatible query format, allowing you to define measures, dimensions, and filters in a business-friendly way rather than writing raw SQL.
Dashboards with Real Analytics
The query API comes with a web UI that gives you proper product analytics capabilities:
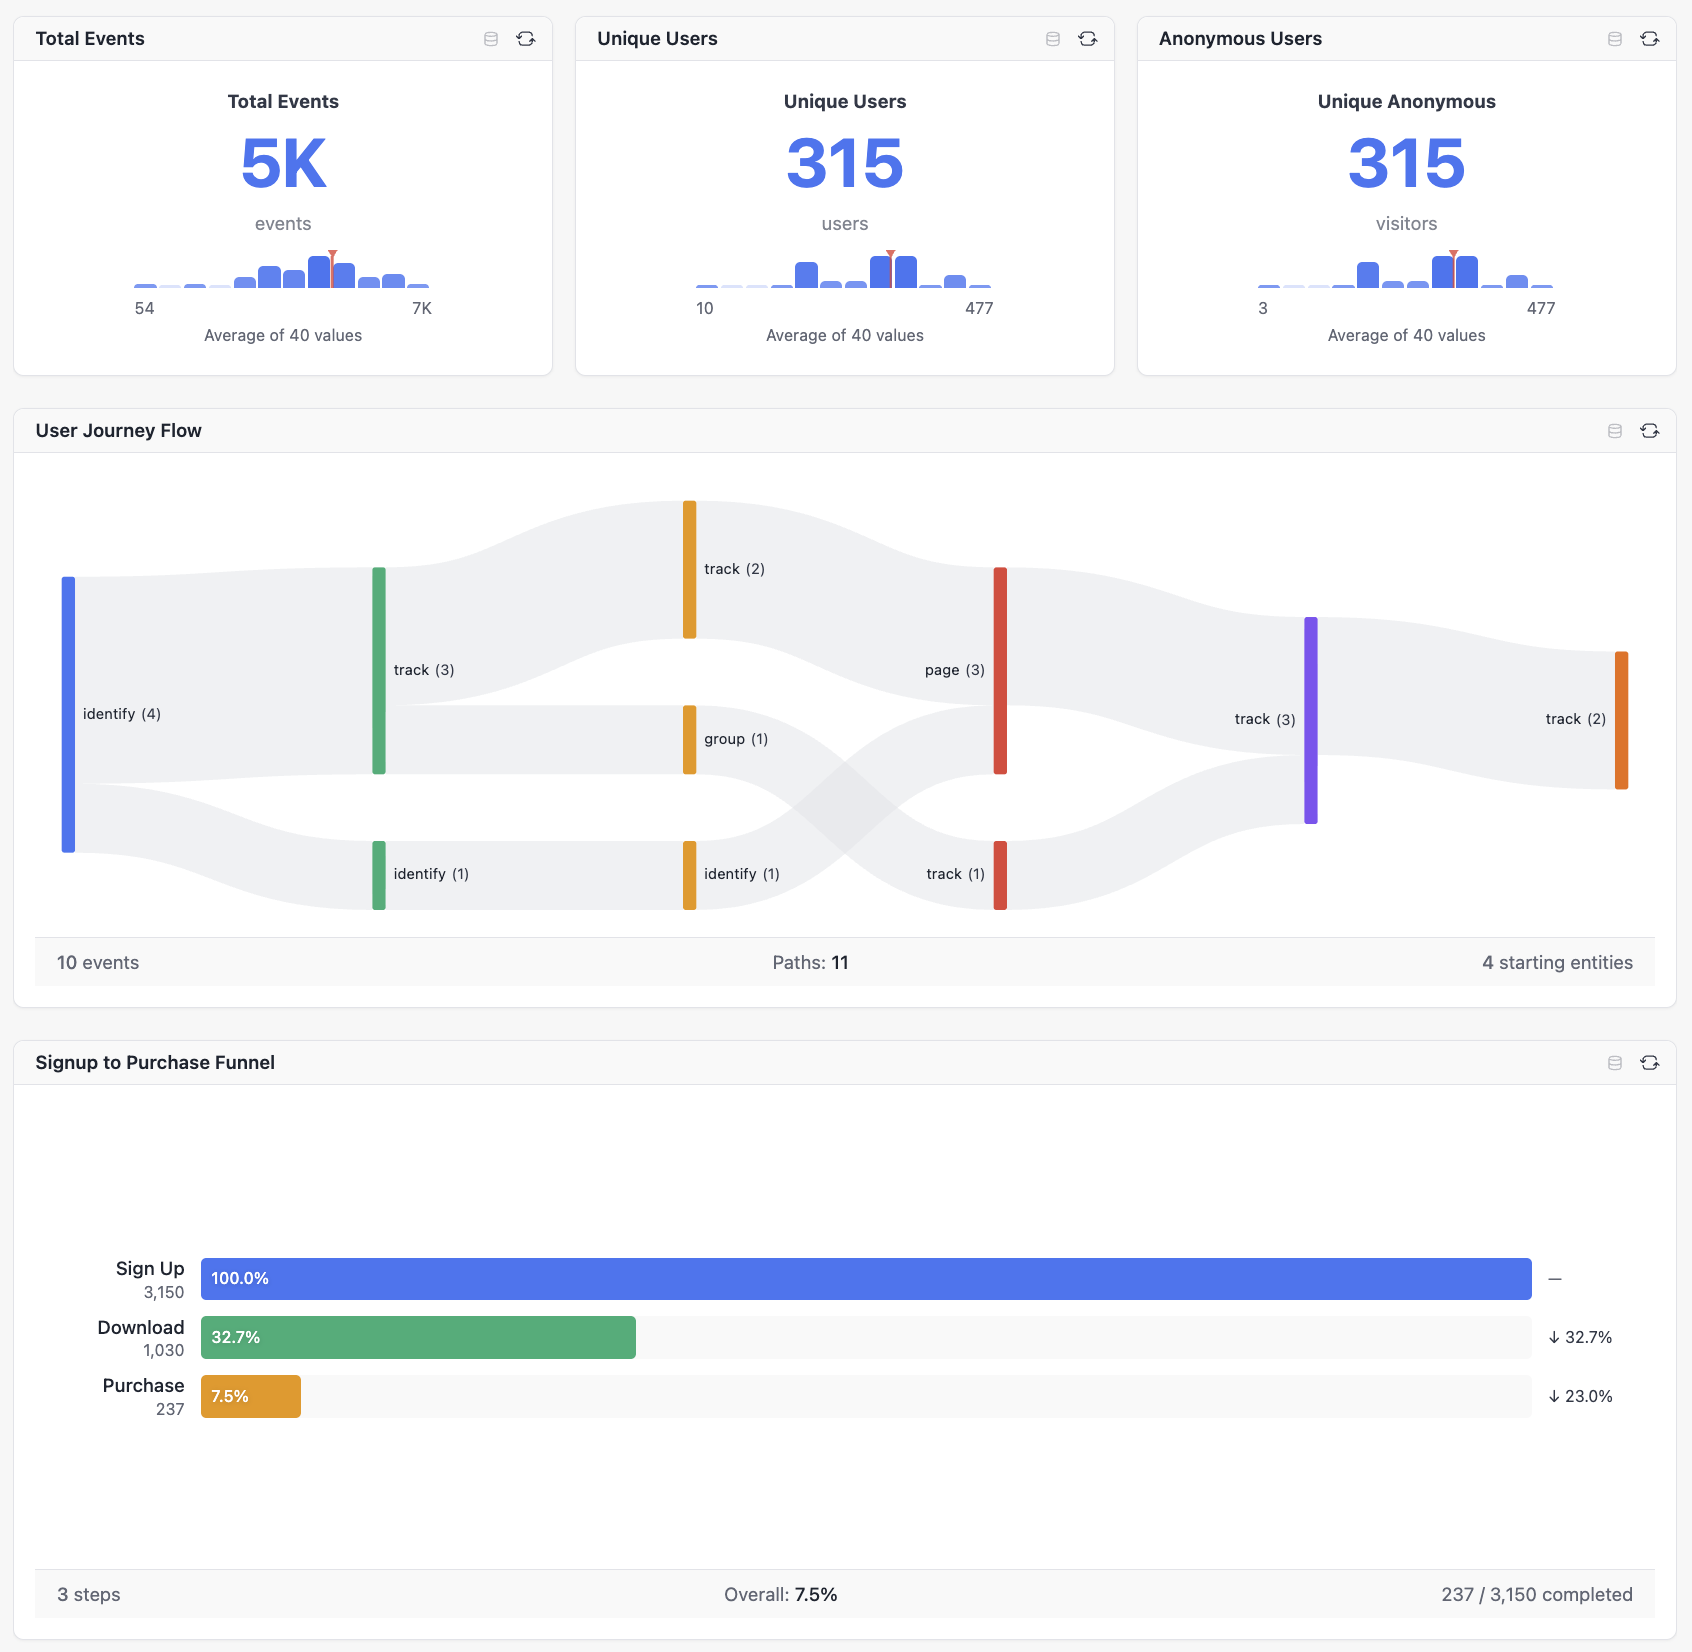
You get metrics, user journey flows, and conversion funnels - the kind of analysis you’d expect from a paid analytics tool, but running entirely on your own infrastructure.
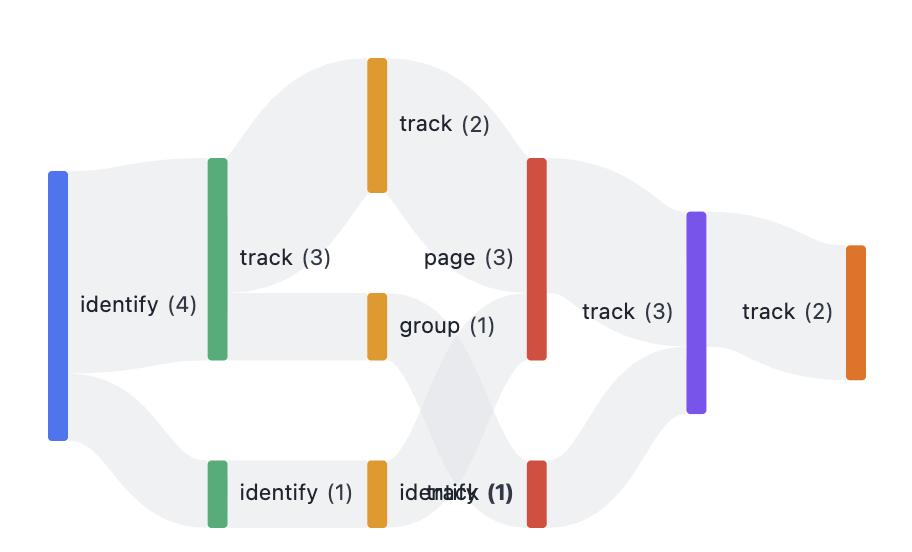
User Journey Analysis
Understanding how users move through your product is critical. The flow visualisation shows you the actual paths users take:
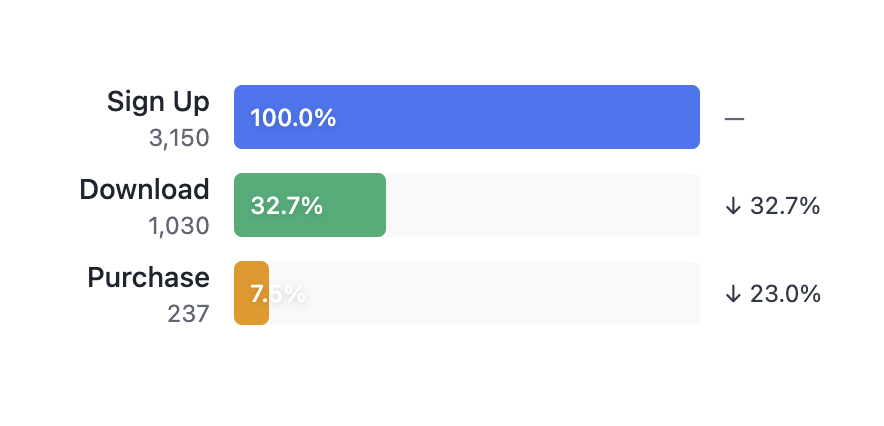
Conversion Funnels
Track conversion through any sequence of events:
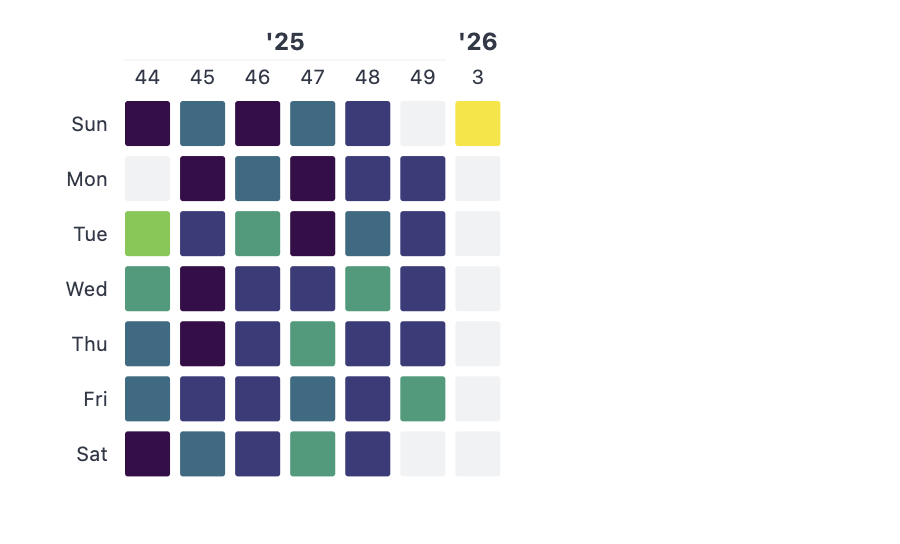
Activity Heatmaps
See when your users are most active:
My Experience So Far
I’ve been running this for a few weeks now, and a few observations:
Pipelines just work. This impressed me the most. Compared to other data stacks I’ve worked with over the years, Cloudflare Pipelines are remarkably straightforward. Events go in, Iceberg tables come out.
It’s definitely still beta. I had to recreate pipelines a couple of times when things stopped syncing to R2. The operational visibility is limited - there’s basically one metrics page and that’s it. When the sink stopped writing, I couldn’t see why, so I just deleted and recreated.
DuckDB is amazing. I’d always assumed DuckDB was a proper server, but it turns out it’s single-process. Once I understood that constraint and built around it, the experience has been excellent. Running near-Postgres-capable SQL directly on Parquet files in R2 is genuinely impressive. Note: this does mean this solution is not designed (without an intermediate caching layer) for high traffic usage - but for an internal analytics use case it should be fine.
The cost model is compelling. With zero egress fees on R2, this could run at very low cost - potentially within the free tier if you don’t have massive data volumes. No infrastructure to manage, just two workers and optionally a container for DuckDB.
Your Data, Your Ecosystem
One of the best things about building on Apache Iceberg is that you’re not locked into a proprietary format. Your analytics data is stored as standard Parquet files with Iceberg metadata, which means you can plug it into the broader data ecosystem.
Want to run transformations with dbt? Connect it to your Iceberg tables. Need to sync data to or from other sources with Airbyte? Iceberg is a supported destination. Want to query the data with Spark, Trino, or PyIceberg? All of these understand the Iceberg format natively.
This is the real power of first-party analytics built on open standards. Icelight gives you a ready-to-use product analytics interface, but the underlying data isn’t trapped there. You can build whatever additional pipelines, models, or integrations you need - your analytics events become just another table in your data lakehouse.
The Technical Details
If you want to dig in, the architecture is:
- Event Ingest Worker: Receives RudderStack/Segment-compatible events and writes to a Pipeline
- Cloudflare Pipeline: Streams events to R2 with automatic Iceberg table management via the Data Catalog
- Query API Worker: Exposes R2 SQL, DuckDB, and a semantic query layer (via Drizzle Cube)
- DuckDB Container: Optional, for more complex SQL queries (JOINs, window functions, etc.)
The event schema is flexible - it captures the standard analytics event types (track, identify, page, screen, group, alias) with arbitrary JSON properties.
import { Analytics } from '@rudderstack/analytics-js';
const analytics = new Analytics({  writeKey: 'any-value',  dataPlaneUrl: 'https://icelight-event-ingest.YOUR-SUBDOMAIN.workers.dev'});
analytics.track('Purchase Completed', { orderId: '12345', revenue: 99.99 });analytics.identify('user-123', { email: 'user@example.com', plan: 'premium' });
What’s Next
I’m going to keep using this for my own projects and see how it scales. I’m particularly curious about:
- How it handles larger data volumes over time
- The compaction behaviour of the Iceberg tables
- Whether I can optimise the DuckDB container further
I’d love to hear from anyone else experimenting with Cloudflare’s data platform. It’s early days, but I think there’s real potential here for small-to-medium scale analytics that doesn’t require the complexity (or cost) of a full-blown data warehouse.
You can try it here: try.icelight.dev
The code (MIT Licensed) is here: Github Repository