Building Analytics Dashboards with Drizzle Cube and Next.js
One question I keep coming back to in my career is: “How do I give my users analytics on their own data, without building an entire BI platform from scratch?”
I’ve worked with Looker, Metabase, PowerBI, Amplitude, Mixpanel - you name it. They’re all great tools for internal analytics, but the moment you want to embed self-service analytics into your product for your customers, things get complicated fast. You either end up with expensive third-party embeddable solutions, or you find yourself building a bespoke reporting engine that becomes its own product to maintain.
So I built Drizzle Cube - an open source, embeddable semantic layer that sits on top of Drizzle ORM. It gives you a type-safe analytics API and a set of React components for dashboards and query building, all running directly against your existing PostgreSQL database. No data warehouse, no ETL pipeline, no separate infrastructure.
In this guide I’m going to walk through exactly how to add Drizzle Cube to a Next.js application, step by step. We’ll go from a Drizzle schema all the way through to interactive dashboards with charts, tables, and a visual query builder.
You can see the finished result deployed here: nextjs.drizzle-cube.dev, and all the source code is on GitHub: drizzle-cube-nextjs.
Let’s get into it.
The Data Model
Before we write any analytics code, let’s talk about what we’re working with. I’ve set up a simple but realistic domain: a company with employees, departments, and daily productivity metrics. This gives us a nice mix of dimension data (who people are, which department they’re in) and fact data (what they did each day).
Here’s how the tables relate to each other:
┌──────────────┐ ┌──────────────┐ ┌──────────────────┐│ departments │ │ employees │ │ productivity │├──────────────┤ ├──────────────┤ ├──────────────────┤│ id (PK) │◄──────│ departmentId │ │ id (PK) ││ name │ │ id (PK) │◄──────│ employeeId ││ budget │ │ name │ │ departmentId ││ org_id │ │ email │ │ date │└──────────────┘ │ active │ │ linesOfCode │ │ salary │ │ pullRequests │ │ org_id │ │ liveDeployments │ │ createdAt │ │ daysOff │ └──────────────┘ │ happinessIndex │ │ org_id │ └──────────────────┘Important
Notice that every table has an organisationId column. This is critical - it’s how we enforce multi-tenant security. Every query that Drizzle Cube executes will automatically filter by this field, ensuring that one customer can never see another customer’s data.
The schema is defined using standard Drizzle ORM - nothing special or analytics-specific about it. If you already have a Drizzle schema in your project, you can use it directly.
Here’s the full schema:
import { pgTable, integer, text, real, boolean, timestamp, jsonb } from 'drizzle-orm/pg-core'import { relations } from 'drizzle-orm'
// Employee tableexport const employees = pgTable('employees', {  id: integer('id').primaryKey().generatedAlwaysAsIdentity(),  name: text('name').notNull(),  email: text('email'),  active: boolean('active').default(true),  departmentId: integer('department_id'),  organisationId: integer('organisation_id').notNull(),  salary: real('salary'),  createdAt: timestamp('created_at').defaultNow()})
// Department tableexport const departments = pgTable('departments', {  id: integer('id').primaryKey().generatedAlwaysAsIdentity(),  name: text('name').notNull(),  organisationId: integer('organisation_id').notNull(),  budget: real('budget')})
// Productivity metrics table - daily productivity data per employeeexport const productivity = pgTable('productivity', {  id: integer('id').primaryKey().generatedAlwaysAsIdentity(),  employeeId: integer('employee_id').notNull(),  departmentId: integer('department_id'),  date: timestamp('date').notNull(),  linesOfCode: integer('lines_of_code').default(0),  pullRequests: integer('pull_requests').default(0),  liveDeployments: integer('live_deployments').default(0),  daysOff: boolean('days_off').default(false),  happinessIndex: integer('happiness_index'), // 1-10 scale  organisationId: integer('organisation_id').notNull(),  createdAt: timestamp('created_at').defaultNow()})
// Define relations for better type inferenceexport const employeesRelations = relations(employees, ({ one, many }) => ({  department: one(departments, {    fields: [employees.departmentId],    references: [departments.id]  }),  productivityMetrics: many(productivity)}))
export const departmentsRelations = relations(departments, ({ many }) => ({  employees: many(employees)}))
export const productivityRelations = relations(productivity, ({ one }) => ({  employee: one(employees, {    fields: [productivity.employeeId],    references: [employees.id]  })}))
// Export schema for use with Drizzleexport const schema = {  employees, departments, productivity,  employeesRelations, departmentsRelations, productivityRelations}
export type Schema = typeof schema
This is a completely standard Drizzle schema. We’re working directly on a PostgreSQL database - there’s no additional data layer or warehouse involved. If you already have tables in your database, you can use drizzle-kit pull to generate the schema from your existing tables.
What Are Cubes?
Now we get to the interesting part. A cube in Drizzle Cube is a business-friendly abstraction over your raw database tables. If you’ve used Cube.js, Looker’s LookML, or dbt metrics - it’s the same concept.
In traditional data modelling you’d distinguish between dimension tables (descriptive data like departments, products, users) and fact tables (event data like transactions, page views, productivity logs). In Drizzle Cube we call them all cubes, because any cube can contain both:
- Dimensions - the things you group by or filter on (department name, employee email, date)
- Measures - the things you aggregate (count of employees, average salary, total lines of code)
The key insight is that your cube definitions transform raw database columns into business concepts. Your users don’t need to know that FTE is stored as fteBasis or that the happiness score is on a 1-10 integer scale - the cube handles that translation.
Each cube also has a sql function that takes a security context and returns a filter. This is how multi-tenant isolation works - every single query automatically includes a WHERE clause filtering by the current user’s organisation.
Let’s look at how this works in practice.
Modelling the Cubes
We’re going to create three cubes: one for employees, one for departments, and one for productivity. Each maps to one of our database tables, but adds business meaning on top.
The Employees Cube
import { eq, sql } from 'drizzle-orm'import { defineCube } from 'drizzle-cube/server'import type { QueryContext, BaseQueryDefinition, Cube } from 'drizzle-cube/server'import { employees, departments, productivity } from './schema'
let employeesCube: Cubelet departmentsCube: Cubelet productivityCube: Cube
employeesCube = defineCube('Employees', {  title: 'Employee Analytics',  description: 'Employee data and metrics',
  // Security context - EVERY cube must have this  sql: (ctx: QueryContext): BaseQueryDefinition => ({    from: employees,    where: eq(employees.organisationId, ctx.securityContext.organisationId as number)  }),
  // How this cube relates to other cubes  joins: {    Departments: {      targetCube: () => departmentsCube,      relationship: 'belongsTo',  // Many employees belong to one department      on: [{ source: employees.departmentId, target: departments.id }]    },    Productivity: {      targetCube: () => productivityCube,      relationship: 'hasMany',    // One employee has many productivity records      on: [{ source: employees.id, target: productivity.employeeId }]    }  },
  dimensions: {    id: {      name: 'id', title: 'Employee ID',      type: 'number', sql: employees.id, primaryKey: true    },    name: {      name: 'name', title: 'Employee Name',      type: 'string', sql: employees.name    },    email: {      name: 'email', title: 'Email Address',      type: 'string', sql: employees.email    },    isActive: {      name: 'isActive', title: 'Active Status',      type: 'boolean', sql: employees.active    },    createdAt: {      name: 'createdAt', title: 'Hire Date',      type: 'time', sql: employees.createdAt    }  },
  measures: {    count: {      name: 'count', title: 'Total Employees',      type: 'count', sql: employees.id    },    activeCount: {      name: 'activeCount', title: 'Active Employees',      type: 'count', sql: employees.id,      filters: [() => eq(employees.active, true)]  // Filtered measure!    },    totalSalary: {      name: 'totalSalary', title: 'Total Salary',      type: 'sum', sql: employees.salary    },    avgSalary: {      name: 'avgSalary', title: 'Average Salary',      type: 'avg', sql: employees.salary, format: 'currency'    }  }}) as Cube
A few things to notice here:
The sql function - this is the security boundary. Every query against this cube will include WHERE employees.organisation_id = ? with the current user’s organisation ID. If you’re not running a multi-tenant system you can simplify this or skip the filter entirely, but for any SaaS application where customers share a database, this is where tenant isolation is enforced.
Joins - we declare that employees belongsTo departments (many-to-one) and hasMany productivity records (one-to-many). This tells Drizzle Cube how to join tables when a user creates a cross-cube query like “show me employee count by department name”.
Filtered measures - activeCount is a count, but with a filter applied. It only counts rows where active = true. This is a powerful pattern - you define the business logic once in the cube, and every query that uses this measure gets the filter automatically.
The Departments Cube
departmentsCube = defineCube('Departments', {  title: 'Department Analytics',  description: 'Department-level metrics and budget analysis',
  sql: (ctx: QueryContext): BaseQueryDefinition => ({    from: departments,    where: eq(departments.organisationId, ctx.securityContext.organisationId as number)  }),
  joins: {    Employees: {      targetCube: () => employeesCube,      relationship: 'hasMany',  // One department has many employees      on: [{ source: departments.id, target: employees.departmentId }]    }  },
  dimensions: {    id: {      name: 'id', title: 'Department ID',      type: 'number', sql: departments.id, primaryKey: true    },    name: {      name: 'name', title: 'Department Name',      type: 'string', sql: departments.name    }  },
  measures: {    count: {      name: 'count', title: 'Department Count',      type: 'count', sql: departments.id    },    totalBudget: {      name: 'totalBudget', title: 'Total Budget',      type: 'sum', sql: departments.budget    },    avgBudget: {      name: 'avgBudget', title: 'Average Budget',      type: 'avg', sql: departments.budget    }  }}) as Cube
Note
Notice the hasMany relationship from Departments to Employees. This is the reverse of the belongsTo on the Employees cube. Drizzle Cube needs both directions defined so it can find join paths between cubes. If you forget to define the reverse relationship, cross-cube queries won’t work.
The Productivity Cube
This one is the most interesting because it shows some more advanced patterns:
productivityCube = defineCube('Productivity', {  title: 'Productivity Analytics',  description: 'Daily productivity metrics including code output and deployments',
  sql: (ctx: QueryContext): BaseQueryDefinition => ({    from: productivity,    where: eq(productivity.organisationId, ctx.securityContext.organisationId as number)  }),
  joins: {    Employees: {      targetCube: () => employeesCube,      relationship: 'belongsTo',      on: [{ source: productivity.employeeId, target: employees.id }]    },    Departments: {      targetCube: () => departmentsCube,      relationship: 'belongsTo',      on: [{ source: productivity.departmentId, target: departments.id }]    }  },
  dimensions: {    id: {      name: 'id', type: 'number',      sql: productivity.id, primaryKey: true    },    date: {      name: 'date', title: 'Date',      type: 'time', sql: productivity.date    },    isDayOff: {      name: 'isDayOff', title: 'Day Off',      type: 'boolean', sql: productivity.daysOff    },    happinessIndex: {      name: 'happinessIndex', title: 'Happiness Index',      type: 'number', sql: productivity.happinessIndex    },    // A calculated dimension - SQL CASE expression!    happinessLevel: {      name: 'happinessLevel', title: 'Happiness Level',      type: 'string',      sql: sql`        CASE          WHEN ${productivity.happinessIndex} >= 8 THEN 'High'          WHEN ${productivity.happinessIndex} >= 6 THEN 'Medium'          ELSE 'Low'        END      `    }  },
  measures: {    count: {      name: 'count', title: 'Total Records',      type: 'count', sql: productivity.id    },    workingDaysCount: {      name: 'workingDaysCount', title: 'Working Days',      type: 'count', sql: productivity.id,      filters: [() => eq(productivity.daysOff, false)]    },    totalLinesOfCode: {      name: 'totalLinesOfCode', title: 'Total Lines of Code',      type: 'sum', sql: productivity.linesOfCode    },    avgLinesOfCode: {      name: 'avgLinesOfCode', title: 'Average Lines of Code',      type: 'avg', sql: productivity.linesOfCode    },    totalPullRequests: {      name: 'totalPullRequests', title: 'Total Pull Requests',      type: 'sum', sql: productivity.pullRequests    },    totalDeployments: {      name: 'totalDeployments', title: 'Total Deployments',      type: 'sum', sql: productivity.liveDeployments    },    avgHappinessIndex: {      name: 'avgHappinessIndex', title: 'Average Happiness',      type: 'avg', sql: productivity.happinessIndex    },    // A composite calculated measure    productivityScore: {      name: 'productivityScore', title: 'Productivity Score',      type: 'avg',      sql: sql`(${productivity.linesOfCode} + ${productivity.pullRequests} * 50 + ${productivity.liveDeployments} * 100)`,      description: 'Composite score based on code output, reviews, and deployments'    }  }}) as Cube
export { employeesCube, departmentsCube, productivityCube }export const allCubes = [employeesCube, departmentsCube, productivityCube]
Two things worth highlighting:
Calculated dimensions - the happinessLevel dimension uses a raw SQL CASE expression to bucket the numeric happiness index into “High”, “Medium”, and “Low”. The user sees friendly labels, but the database stores integers. This is exactly the kind of business logic that belongs in a semantic layer.
Calculated measures - the productivityScore measure combines lines of code, pull requests (weighted x50), and deployments (weighted x100) into a single composite score. Users can use this measure without knowing the formula - they just see “Productivity Score” in the query builder.
Setting Up the Database
For local development we use Docker to run PostgreSQL. The docker-compose.yml is minimal:
version: '3.8'
services:  postgres:    image: postgres:17-alpine    container_name: drizzle-cube-nextjs-postgres    environment:      POSTGRES_DB: drizzle_cube_db      POSTGRES_USER: drizzle_user      POSTGRES_PASSWORD: drizzle_pass123    ports:      - "54924:5432"    volumes:      - postgres_data:/var/lib/postgresql/data
volumes:  postgres_data:    driver: local
And the Drizzle Kit config points at our schema:
import { defineConfig } from 'drizzle-kit'
export default defineConfig({  schema: './schema.ts',  out: './drizzle',  dialect: 'postgresql',  dbCredentials: {    url: process.env.DATABASE_URL ||      'postgresql://drizzle_user:drizzle_pass123@localhost:54924/drizzle_cube_db'  },  verbose: true,  strict: true})
The example repo includes scripts to get everything running in one command:
# Start Postgres, run migrations, seed sample datanpm run setup
# Or step by step:npm run docker:up       # Start PostgreSQL containernpm run db:migrate      # Run Drizzle migrationsnpm run db:seed         # Seed sample data (employees, departments, 30 days of metrics)
The seed script creates 4 departments (Engineering, Marketing, Sales, HR), 6 employees across those departments, and generates 30 days of realistic productivity data with random variation in lines of code, pull requests, deployments, and happiness scores.
Wiring Up the Backend
Now we get to the integration point. We need to create an API route that Drizzle Cube’s React components can talk to. This is where the Next.js adapter comes in.
Database Connection
First, a simple database connection factory:
import { drizzle } from 'drizzle-orm/postgres-js'import { drizzle as drizzleNeon } from 'drizzle-orm/neon-http'import postgres from 'postgres'import { neon } from '@neondatabase/serverless'import { schema } from '../schema'
const connectionString = process.env.DATABASE_URL ||  'postgresql://drizzle_user:drizzle_pass123@localhost:54924/drizzle_cube_db'
function isNeonUrl(url: string): boolean {  return url.includes('.neon.tech') || url.includes('neon.database')}
export function createDatabase(databaseUrl: string) {  if (isNeonUrl(databaseUrl)) {    const sql = neon(databaseUrl)    return drizzleNeon(sql, { schema })  } else {    const client = postgres(databaseUrl)    return drizzle(client, { schema })  }}
export const db = createDatabase(connectionString)
This auto-detects whether you’re connecting to a Neon serverless database or a local PostgreSQL instance. In production, you’d set DATABASE_URL to your Neon connection string and it just works.
The API Route
Here’s where the magic happens. A single catch-all API route handles all the Cube.js-compatible endpoints:
import { NextRequest } from 'next/server'import { createCubeHandlers } from 'drizzle-cube/adapters/nextjs'import { db } from '@/lib/db'import { schema } from '@/schema'import { allCubes } from '@/cubes'
// Security context - in production, extract from your auth systemconst extractSecurityContext = async () => {  return {    organisationId: 1,    userId: 1  }}
// Create all cube handlers in one callconst handlers = createCubeHandlers({  cubes: allCubes,  drizzle: db as never,  schema,  extractSecurityContext,  engineType: 'postgres'})
// Route handlerasync function routeHandler(  request: NextRequest,  { params }: { params: Promise<{ path: string[] }> }) {  const { path: pathArray } = await params  const path = pathArray.join('/')
  if (path === 'load') return handlers.load(request)  else if (path === 'meta') return handlers.meta(request)  else if (path === 'sql') return handlers.sql(request)  else if (path === 'dry-run') return handlers.dryRun(request)  else if (path === 'batch') return handlers.batch(request)  else return new Response('Not Found', { status: 404 })}
export const GET = routeHandlerexport const POST = routeHandler
That’s it for the backend. Let’s break down what’s happening:
-
createCubeHandlerstakes your cubes, your Drizzle database instance, your schema, and a function that extracts the security context from the request. It returns handler functions for each endpoint. -
The catch-all route
[...path]matches/api/cubejs-api/v1/load,/api/cubejs-api/v1/meta, etc., and delegates to the right handler. -
Security context - in this demo it’s hardcoded to
organisationId: 1. In a real application, you’d extract this from your session, JWT token, or whatever auth system you use. I showed a more complete example in my Fintune implementation post.
Important
The extractSecurityContext function is called on every request. This is where you integrate with your auth system. The security context is then passed to every cube’s sql function, which uses it to filter data. This is how multi-tenant isolation works - it’s not optional, it’s built into the architecture.
The API endpoints follow the Cube.js REST API format, which means if you’re migrating from Cube.js, your existing queries will work.
Building the Frontend
Now let’s work forward from the API to the React components. There are three things to set up: styles, the provider, and the actual dashboard/query components.
1. Importing Styles
In your globals.css, import the Drizzle Cube styles and tell Tailwind to scan the component library:
@import "tailwindcss";@import 'drizzle-cube/client/styles.css';@source "../node_modules/drizzle-cube/dist/client";Note
Drizzle Cube uses a dc: prefix for all its Tailwind utilities, so there’s no conflict with your own styles. The @source directive tells Tailwind v4 to scan the Drizzle Cube components for class names.
2. The CubeProvider
Every page that uses Drizzle Cube components needs to be wrapped in a CubeProvider. This sets up the API client and provides metadata to all child components:
'use client'
import { CubeProvider } from 'drizzle-cube/client'import DashboardTab from '@/components/DashboardTab'
export default function DashboardPage() {  return (    <CubeProvider      apiOptions={{ apiUrl: '/api/cubejs-api/v1' }}      features={{ enableAI: false }}    >      <div className="max-w-7xl mx-auto px-4 sm:px-6 lg:px-8 py-8">        <DashboardTab />      </div>    </CubeProvider>  )}
The apiUrl points to the API route we created. That’s the only configuration needed - the provider handles fetching cube metadata, setting up the query client, and managing cache.
3. The Analytics Dashboard
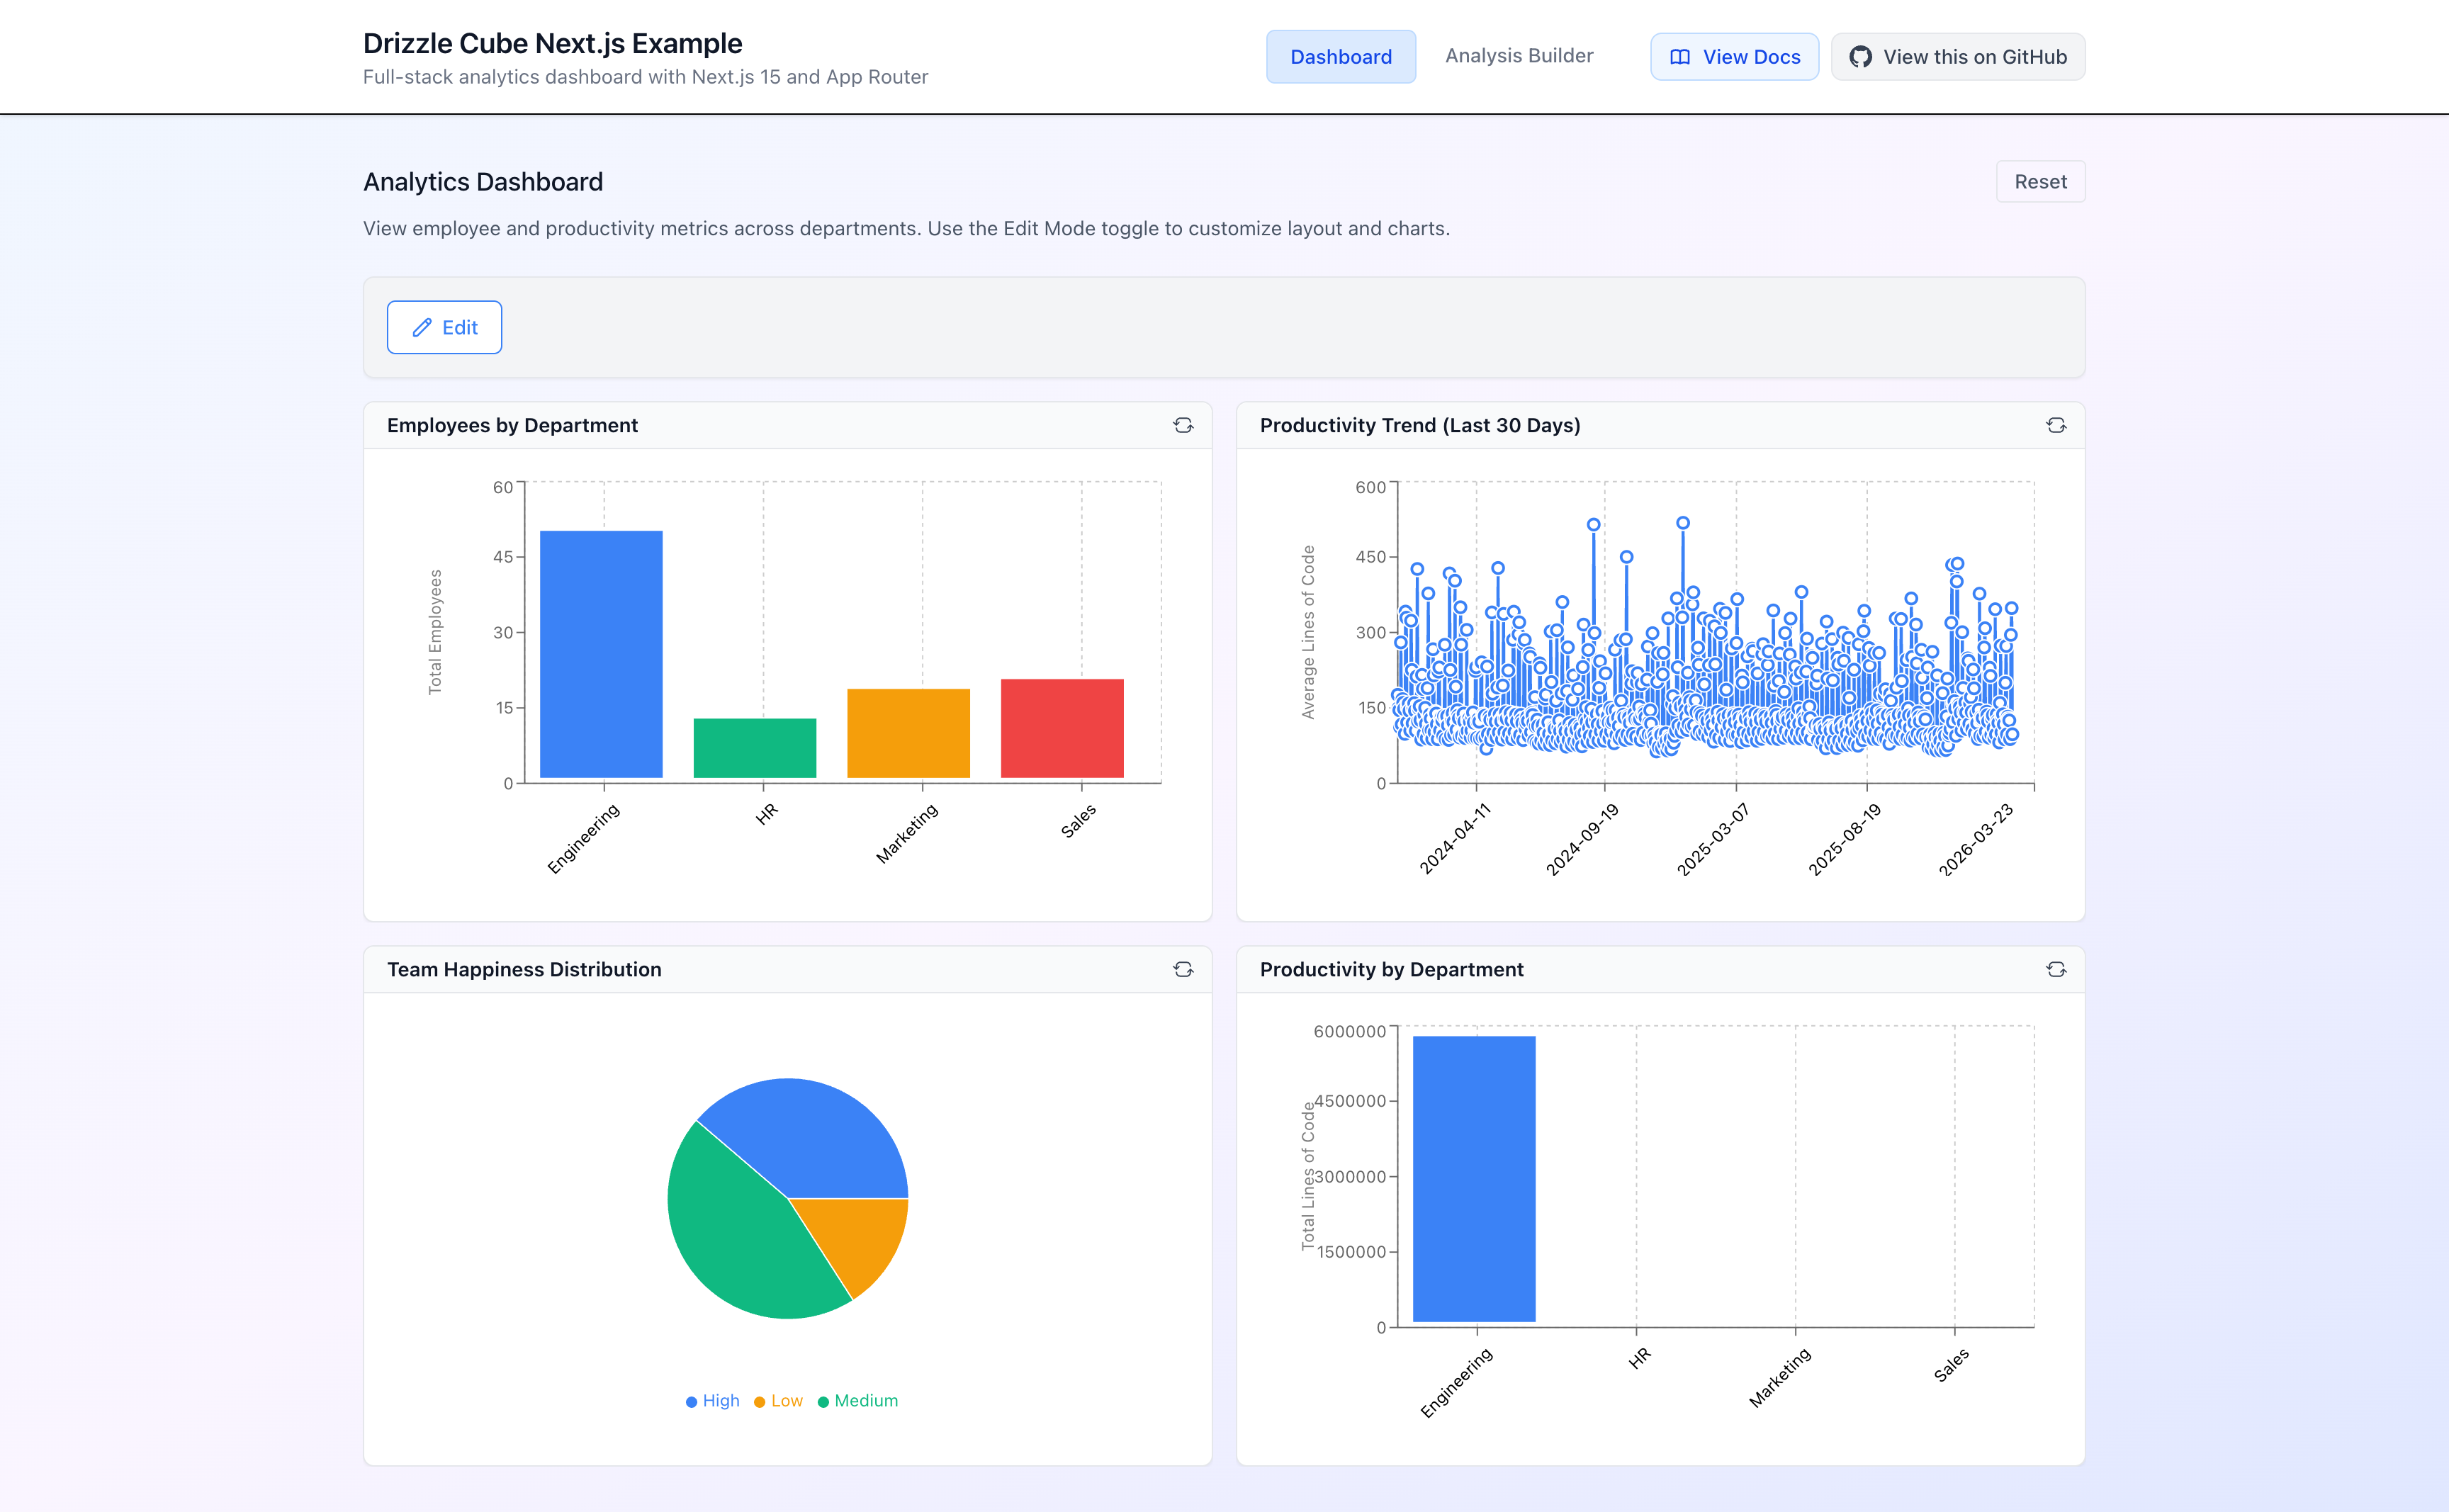
The AnalyticsDashboard component gives you a full drag-and-drop dashboard with configurable chart portlets:
'use client'
import { useState, useEffect } from 'react'import { AnalyticsDashboard } from 'drizzle-cube/client'import { dashboardConfig as defaultDashboardConfig } from '@/lib/dashboard-config'
export default function DashboardTab() {  const [dashboardConfig, setDashboardConfig] = useState(defaultDashboardConfig)
  // Load from localStorage on mount  useEffect(() => {    const savedConfig = localStorage.getItem('nextjs-dashboard-config')    if (savedConfig) {      try {        setDashboardConfig(JSON.parse(savedConfig))      } catch (error) {        console.error('Failed to load dashboard config:', error)      }    }  }, [])
  const saveDashboardConfig = (newConfig: any) => {    setDashboardConfig(newConfig)    localStorage.setItem('nextjs-dashboard-config', JSON.stringify(newConfig))  }
  return (    <AnalyticsDashboard      config={dashboardConfig}      editable={true}      onConfigChange={saveDashboardConfig}    />  )}
The dashboard configuration is a JSON object that describes the portlets - their queries, chart types, and grid positions. Here’s what the default configuration looks like:
export const dashboardConfig = { portlets: [ { id: 'employees-by-dept', title: 'Employees by Department', query: JSON.stringify({ measures: ['Employees.count'], dimensions: ['Departments.name'], }), chartType: 'bar' as const, chartConfig: { xAxis: ['Departments.name'], yAxis: ['Employees.count'] }, displayConfig: { showLegend: false }, x: 0, y: 0, w: 6, h: 4 // Grid position and size }, { id: 'productivity-trend', title: 'Productivity Trend (Last 30 Days)', query: JSON.stringify({ measures: ['Productivity.avgLinesOfCode'], timeDimensions: [{ dimension: 'Productivity.date', granularity: 'day' }], filters: [{ member: 'Productivity.isDayOff', operator: 'equals', values: [false] }] }), chartType: 'line' as const, chartConfig: { xAxis: ['Productivity.date'], yAxis: ['Productivity.avgLinesOfCode'] }, displayConfig: { showLegend: false }, x: 6, y: 0, w: 6, h: 4 }, { id: 'happiness-distribution', title: 'Team Happiness Distribution', query: JSON.stringify({ measures: ['Productivity.recordCount'], dimensions: ['Productivity.happinessLevel'], filters: [{ member: 'Productivity.isDayOff', operator: 'equals', values: [false] }] }), chartType: 'pie' as const, chartConfig: { xAxis: ['Productivity.happinessLevel'], yAxis: ['Productivity.recordCount'] }, displayConfig: { showLegend: true }, x: 0, y: 4, w: 6, h: 4 }, { id: 'department-productivity', title: 'Productivity by Department', query: JSON.stringify({ measures: ['Productivity.totalLinesOfCode'], dimensions: ['Departments.name'], }), chartType: 'bar' as const, chartConfig: { xAxis: ['Departments.name'], yAxis: ['Productivity.totalLinesOfCode'] }, displayConfig: { showLegend: false }, x: 6, y: 4, w: 6, h: 4 } ]}Each portlet defines:
- A query using the Cube.js query format (measures, dimensions, filters, time dimensions)
- A chart type (bar, line, pie, area, table, etc.)
- A chart config mapping query fields to axes
- A grid position (x, y, w, h) on a 12-column grid
Notice how the queries reference fields using CubeName.fieldName - like Employees.count or Departments.name. This is the semantic layer at work. The user doesn’t need to know about table names or SQL - they work with business concepts.
Also notice the last portlet - “Productivity by Department” - queries measures from the Productivity cube and dimensions from the Departments cube. Drizzle Cube automatically detects that it needs to join across cubes and figures out the join path (Productivity -> Departments via departmentId).
4. The Analysis Builder
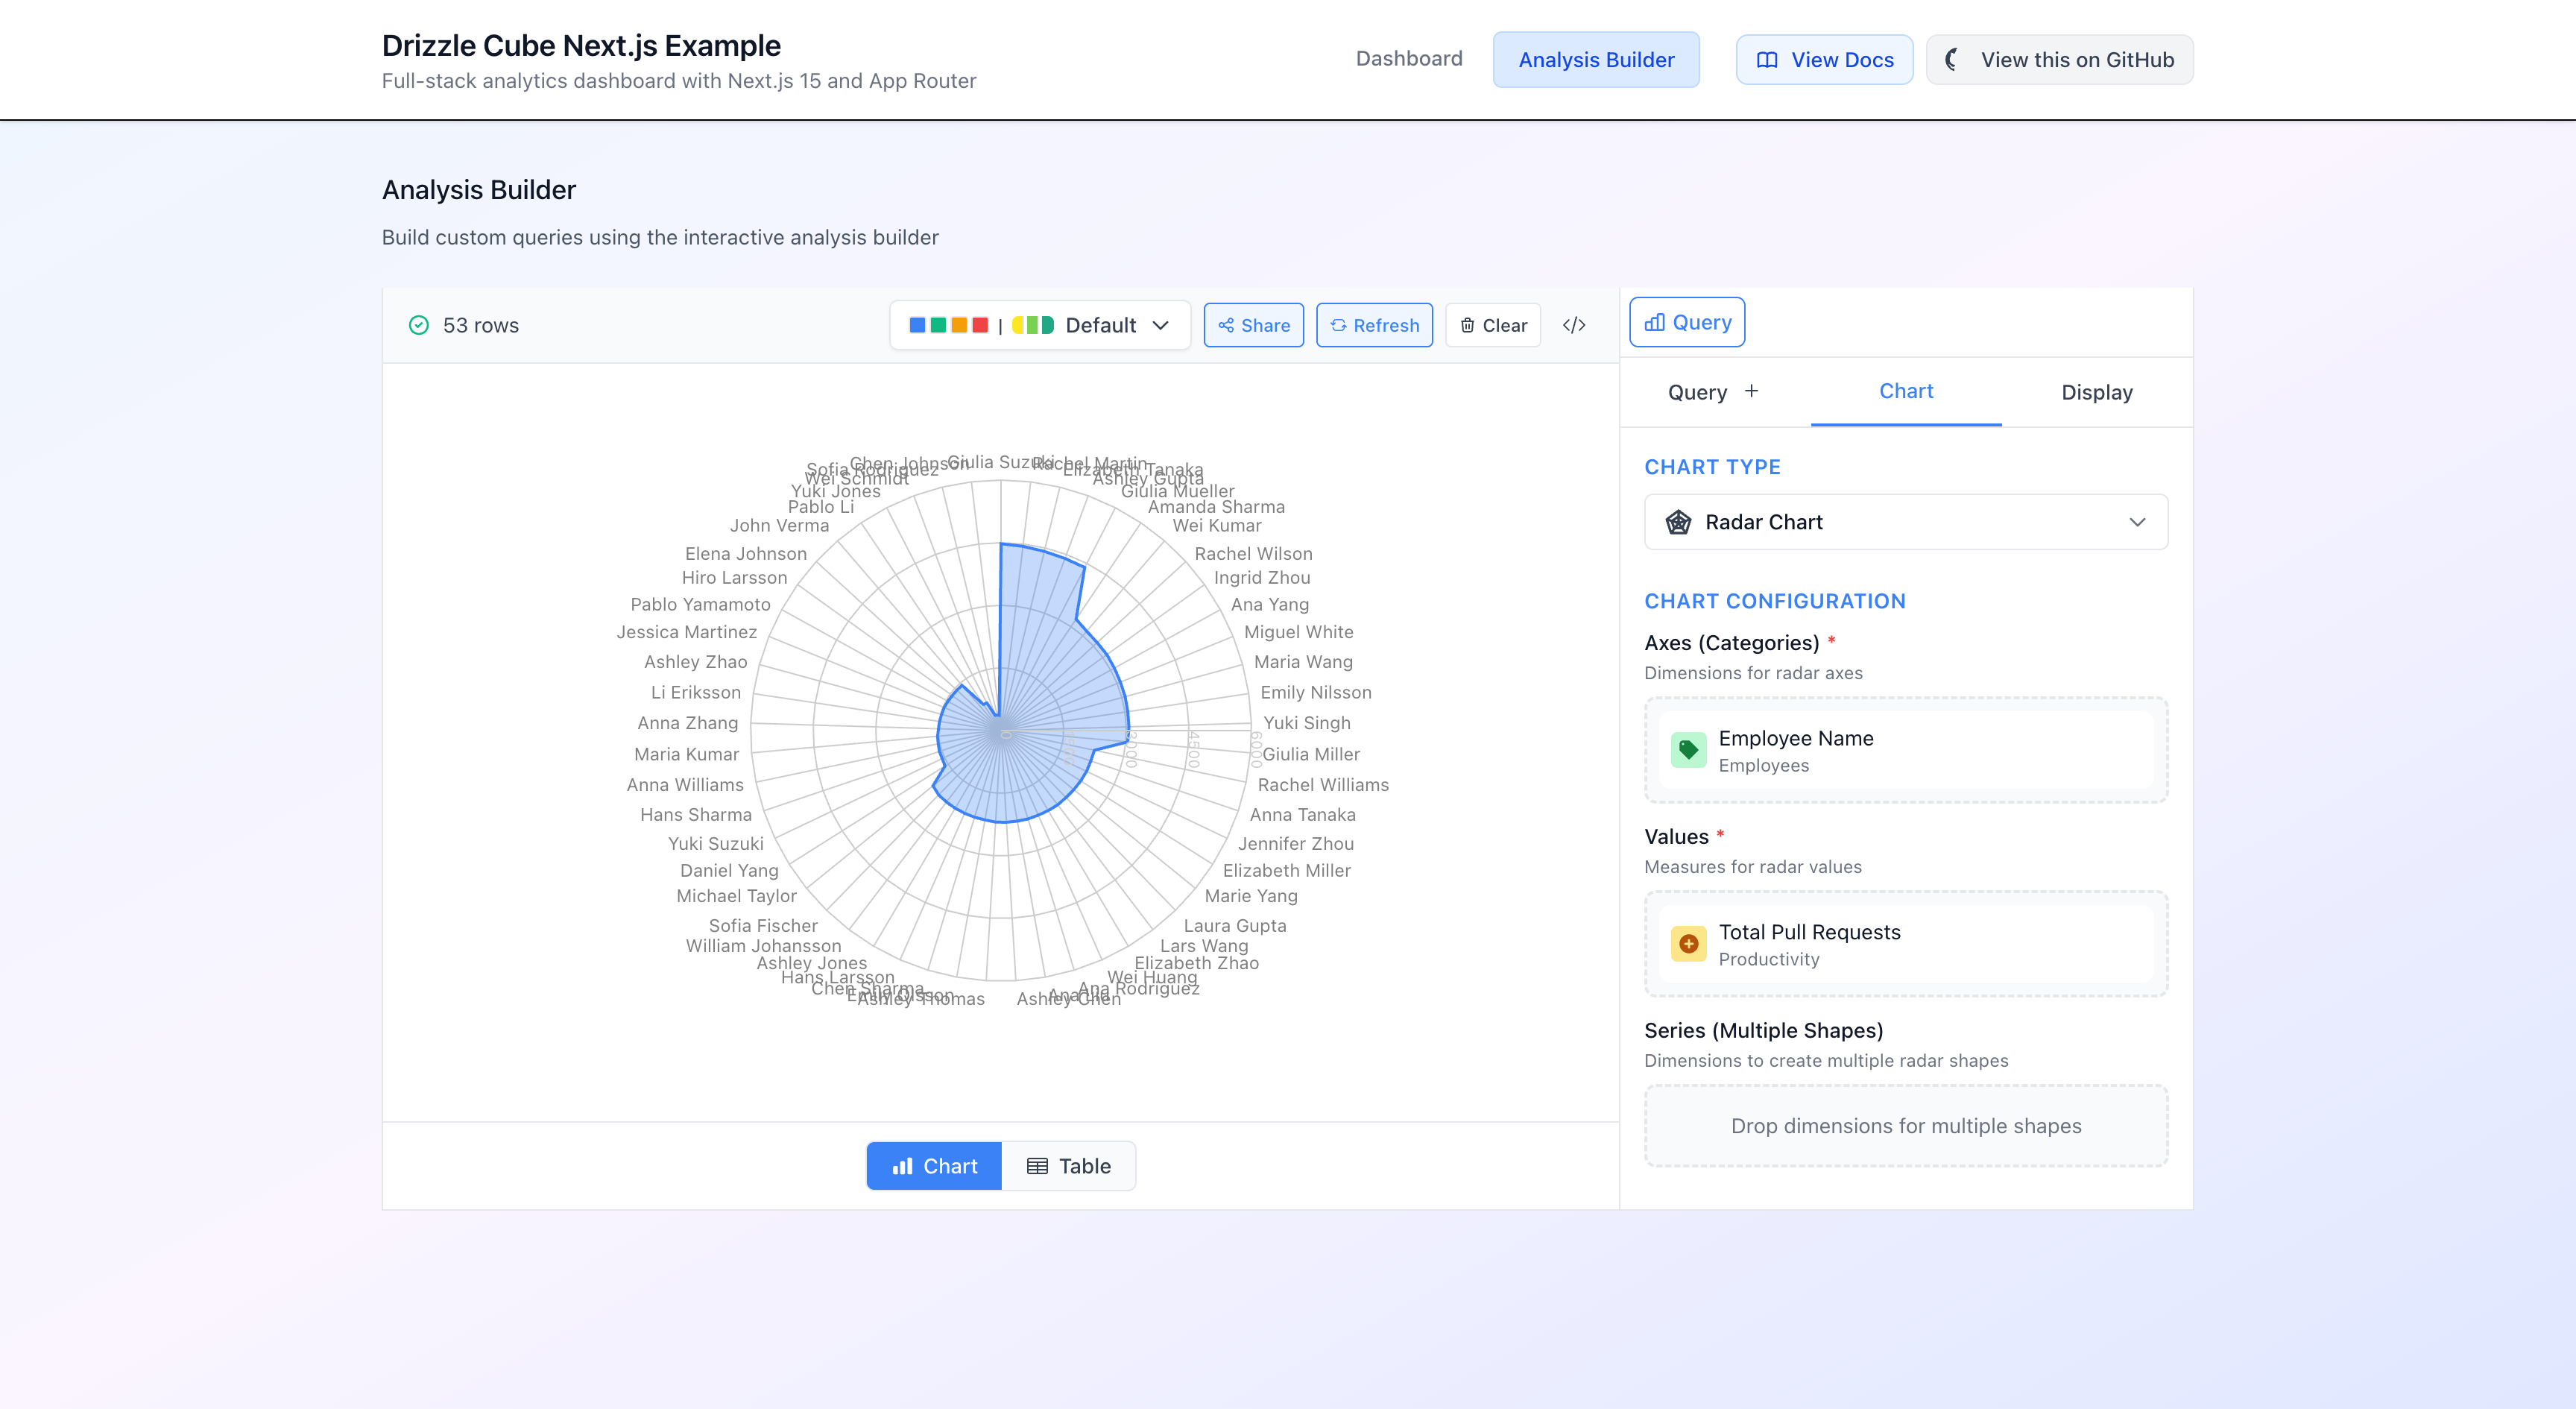
For ad-hoc queries, there’s the AnalysisBuilder component. This gives users a visual query builder where they can pick measures, dimensions, filters, and chart types:
'use client'
import { AnalysisBuilder } from 'drizzle-cube/client'
export default function AnalysisBuilderTab() {  return (    <div>      <div className="mb-6">        <h2 className="text-lg font-medium text-gray-900 mb-2">          Analysis Builder        </h2>        <p className="text-sm text-gray-600">          Build custom queries using the interactive analysis builder        </p>      </div>      <AnalysisBuilder />    </div>  )}
Yes, that’s the entire component. One import, one line of JSX. The AnalysisBuilder handles everything: field selection, query building, data fetching, chart rendering, and switching between chart and table views.
How It All Fits Together
Here’s the full request flow, from browser to database and back:
Browser (React) │ ├─ CubeProvider fetches /meta → gets cube definitions │ └─ User builds query (via Dashboard or AnalysisBuilder) │ ▼ POST /api/cubejs-api/v1/load │ ▼ Next.js API Route │ ├─ extractSecurityContext() → { organisationId: 1 } │ └─ createCubeHandlers.load() │ ▼ Drizzle Cube Semantic Layer │ ├─ Validates query against cube definitions ├─ Resolves join paths between cubes ├─ Applies security context to ALL tables ├─ Builds Drizzle query (type-safe, parameterised) │ └─ Executes via Drizzle ORM │ ▼ PostgreSQL → Results → JSON Response → ChartThe query format is Cube.js compatible, so if you’ve ever used Cube.js you’ll feel right at home:
{ "measures": ["Employees.count"], "dimensions": ["Departments.name"], "filters": [ { "member": "Employees.isActive", "operator": "equals", "values": [true] } ]}The security context flows through every part of this pipeline. When Drizzle Cube builds the SQL, it applies your organisation filter to every table involved in the query - not just the primary one, but all joined tables too. You literally cannot query data from another organisation, even with a crafted API request, because the filter is applied at the cube definition level.
Running It Yourself
Want to try it out? Here’s how to get the example running locally:
# Clone the repositorygit clone https://github.com/cliftonc/drizzle-cube-nextjs.gitcd drizzle-cube-nextjs
# Install dependenciesnpm install
# Start Postgres, run migrations, seed data - all in one commandnpm run setup
# Start the development servernpm run dev
Open http://localhost:6001 and you should see the dashboard with four charts showing employee and productivity data. Click “Analysis Builder” in the nav to start building your own queries.
Or if you just want to see it in action without running anything, check out the deployed version at nextjs.drizzle-cube.dev.
What’s Next
This guide covered the basics - schema, cubes, backend API, and frontend components. There’s a lot more you can do with Drizzle Cube:
- Funnel analysis - track conversion funnels through event sequences
- Flow analysis - visualise user journeys through your product
- Time comparisons - period-over-period analysis (this week vs last week)
- AI query generation - natural language to analytics queries
- Multiple adapters - same cubes work with Express, Fastify, Hono, or Next.js
- Dashboard persistence - save dashboard configs to your database (I showed how in the Fintune implementation post)
The full documentation is at drizzle-cube.dev, and the source code (MIT licensed) is at github.com/cliftonc/drizzle-cube.
If you try it out I’d love to hear how it goes. And if you hit any issues or have feature requests, open an issue on GitHub - I’m actively developing this and real-world feedback is invaluable.